2 Segment information
General disclosures
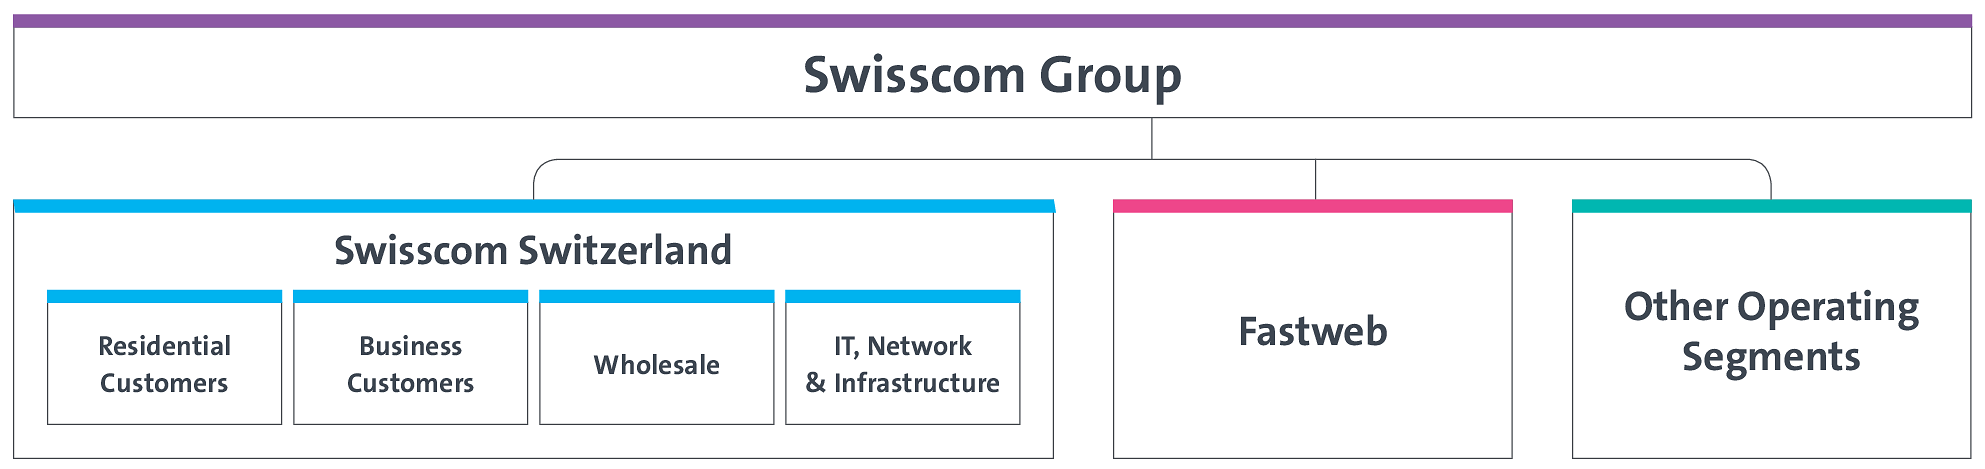
Reporting is divided into the segments Residential Customers, Business Customers, Wholesale and Infrastructure & Support Functions, which are grouped under Swisscom Switzerland, as well as Fastweb and Other Operating Segments.
For its services, the Infrastructure & Support Functions segment does not charge any network costs or management fees to other segments. The remaining services between the segments are charged at market prices. The results of the Residential Customers, Business Customers and Wholesale segments thus correspond to a contribution margin before network costs.
Segment expense encompasses the direct and indirect costs, which include personnel expense, other operating costs less capitalised costs of self-constructed assets and other income. Pension cost includes ordinary employer contributions. The difference between the ordinary employer contributions and the pension cost as provided for under IAS 19 is reported in the column ‘Eliminations’. In the first nine months of 2023, the Eliminations segment result includes income of CHF 28 million (prior year: expenses of CHF 45 million) as a pension cost reconciliation item in accordance with IAS 19.
Leases between the segments are not recognised in the balance sheet in accordance with IFRS 16. The reported lease expense of the segments comprises depreciation and interest on leases excluding depreciation of indefeasible rights of use (IRU) of CHF 14 million (prior year: CHF 15 million) and the accounting for the rental of buildings between segments. The lease expense of financial position, of low value is presented as direct costs.
Capital expenditure consists of the purchase of property, plant and equipment and intangible assets and payments for indefeasible rights of use (IRU). In general, IRUs are paid in full at the beginning of the use and are classified as leases under IFRS 16. From an economic point of view, IRU payments will be considered as capital expenditure in the segment information. Capital expenditure in the first nine months of 2023 includes IRU payments of CHF 15 million (prior year: CHF 10 million).
Changes in segment reporting
Swisscom has reallocated various areas within Swisscom Switzerland to the segments as of 1 January 2023. The adjustments lead to cost shifts between the segments of Swisscom Switzerland. The changes have no effect on the reporting of revenue. The previous year’s figures for Swisscom Switzerland were adjusted as follows:
| In CHF million | Reported | Adjustment | Restated | |||
|---|---|---|---|---|---|---|
| Operating income before depreciation and amortisation (EBITDA) Swisscom Switzerland Financial year 2022 | ||||||
| Residential Customers | 2,975 | 4 | 2,979 | |||
| Business Customers | 1,384 | (3) | 1,381 | |||
| Wholesale | 291 | (2) | 289 | |||
| Infrastructure & Support Functions | (1,166) | 1 | (1,165) | |||
| Intersegment elimination | (1) | – | (1) | |||
| EBITDA Swisscom Switzerland | 3,483 | – | 3,483 | |||
Segment information 2023
1.01.–30.09.2023, in CHF million |
Swisscom Switzerland |
Fastweb |
Other Operating Segments |
Elimination |
Total |
|||||
|---|---|---|---|---|---|---|---|---|---|---|
| Residential Customers | 3,334 | 852 | – | – | 4,186 | |||||
| Enterprise Customers | 2,272 | 798 | 312 | – | 3,382 | |||||
| Wholesale customers | 415 | 219 | – | – | 634 | |||||
| External revenue | 6,021 | 1,869 | 312 | – | 8,202 | |||||
| Intersegment revenue | 46 | 4 | 458 | (508) | – | |||||
| Revenue | 6,067 | 1,873 | 770 | (508) | 8,202 | |||||
| Direct costs | (1,246) | (725) | (61) | 53 | (1,979) | |||||
| Indirect costs | (2,054) | (534) | (610) | 452 | (2,746) | |||||
| Operating income before depreciation and amortisation (EBITDA) | 2,767 | 614 | 99 | (3) | 3,477 | |||||
| Depreciation and amortisation of property, plant and equipment and intangible assets | (1,566) | |||||||||
| Depreciation of right-of-use assets | (197) | |||||||||
| Operating income (EBIT) | 1,714 | |||||||||
| Financial income | 25 | |||||||||
| Financial expense | (118) | |||||||||
| Result of equity-accounted investees | – | |||||||||
| Income before income taxes | 1,621 | |||||||||
| Income tax expense | (311) | |||||||||
| Net income | 1,310 | |||||||||
| EBITDA | 2,767 | 614 | 99 | (3) | 3,477 | |||||
| Lease expense | (169) | (40) | (8) | – | (217) | |||||
| EBITDA after lease expense (EBITDAaL) | 2,598 | 574 | 91 | (3) | 3,260 | |||||
| Capital expenditure | (1,197) | (436) | (28) | 31 | (1,630) | |||||
| Operating free cash flow proxy | 1,401 | 138 | 63 | 28 | 1,630 |
Segment information Swisscom Switzerland 2023
1.01.–30.09.2023, in CHF million |
Residential Customers |
Business Customers |
Wholesale |
Infrastructure & Support Functions |
Elimination |
Total Swisscom Switzerland |
||||||
|---|---|---|---|---|---|---|---|---|---|---|---|---|
| Fixed-line | 1,491 | 607 | – | – | (1) | 2,097 | ||||||
| Mobile | 1,392 | 545 | – | – | 1 | 1,938 | ||||||
| Telecom services | 2,883 | 1,152 | – | – | – | 4,035 | ||||||
| IT services | – | 877 | – | – | – | 877 | ||||||
| Merchandise | 342 | 240 | – | – | 1 | 583 | ||||||
| Wholesale | – | – | 402 | – | – | 402 | ||||||
| Revenue other | 109 | 3 | – | 13 | (1) | 124 | ||||||
| External revenue | 3,334 | 2,272 | 402 | 13 | – | 6,021 | ||||||
| Intersegment revenue | 11 | 32 | 10 | 44 | (51) | 46 | ||||||
| Revenue | 3,345 | 2,304 | 412 | 57 | (51) | 6,067 | ||||||
| Direct costs | (628) | (542) | (188) | (6) | 118 | (1,246) | ||||||
| Indirect costs | (475) | (743) | (4) | (766) | (66) | (2,054) | ||||||
| Operating income before depreciation and amortisation (EBITDA) | 2,242 | 1,019 | 220 | (715) | 1 | 2,767 | ||||||
| Capital expenditure | (27) | (35) | – | (1,135) | – | (1,197) |
Segment information 2022
1.01.–30.09.2022, in CHF million, restated |
Swisscom Switzerland |
Fastweb |
Other Operating Segments |
Elimination |
Total |
|||||
|---|---|---|---|---|---|---|---|---|---|---|
| Residential Customers | 3,357 | 864 | – | – | 4,221 | |||||
| Enterprise Customers | 2,285 | 742 | 307 | – | 3,334 | |||||
| Wholesale customers | 418 | 206 | – | – | 624 | |||||
| External revenue | 6,060 | 1,812 | 307 | – | 8,179 | |||||
| Intersegment revenue | 46 | 6 | 452 | (504) | – | |||||
| Revenue | 6,106 | 1,818 | 759 | (504) | 8,179 | |||||
| Direct costs | (1,265) | (638) | (53) | 50 | (1,906) | |||||
| Indirect costs | (2,176) | (547) | (584) | 375 | (2,932) | |||||
| Operating income before depreciation and amortisation (EBITDA) | 2,665 | 633 | 122 | (79) | 3,341 | |||||
| Depreciation and amortisation of property, plant and equipment and intangible assets | (1,583) | |||||||||
| Depreciation of right-of-use assets | (201) | |||||||||
| Operating income (EBIT) | 1,557 | |||||||||
| Financial income | 72 | |||||||||
| Financial expense | (119) | |||||||||
| Result of equity-accounted investees | (2) | |||||||||
| Income before income taxes | 1,508 | |||||||||
| Income tax expense | (294) | |||||||||
| Net income | 1,214 | |||||||||
| EBITDA | 2,665 | 633 | 122 | (79) | 3,341 | |||||
| Lease expense | (167) | (43) | (8) | (1) | (219) | |||||
| EBITDA after lease expense (EBITDAaL) | 2,498 | 590 | 114 | (80) | 3,122 | |||||
| Capital expenditure | (1,161) | (453) | (22) | 35 | (1,601) | |||||
| Operating free cash flow proxy | 1,337 | 137 | 92 | (45) | 1,521 |
Segment information Swisscom Switzerland 2022
1.01.–30.09.2022, in CHF million, restated |
Residential Customers |
Business Customers |
Wholesale |
Infrastructure & Support Functions |
Elimination |
Total Swisscom Switzerland |
||||||
|---|---|---|---|---|---|---|---|---|---|---|---|---|
| Fixed-line | 1,506 | 631 | – | – | (1) | 2,136 | ||||||
| Mobile | 1,391 | 563 | – | – | 1 | 1,955 | ||||||
| Telecom services | 2,897 | 1,194 | – | – | – | 4,091 | ||||||
| IT services | – | 855 | – | – | – | 855 | ||||||
| Merchandise | 374 | 237 | – | – | – | 611 | ||||||
| Wholesale | – | – | 405 | – | – | 405 | ||||||
| Revenue other | 86 | (1) | – | 13 | – | 98 | ||||||
| External revenue | 3,357 | 2,285 | 405 | 13 | – | 6,060 | ||||||
| Intersegment revenue | 13 | 36 | 8 | 41 | (52) | 46 | ||||||
| Revenue | 3,370 | 2,321 | 413 | 54 | (52) | 6,106 | ||||||
| Direct costs | (639) | (551) | (190) | (7) | 122 | (1,265) | ||||||
| Indirect costs | (498) | (719) | (14) | (876) | (69) | (2,176) | ||||||
| Operating income before depreciation and amortisation (EBITDA) | 2,233 | 1,051 | 209 | (829) | 1 | 2,665 | ||||||
| Capital expenditure | (31) | (32) | – | (1,098) | – | (1,161) |