Statement of added value
Thanks to a modern, high-performance network infrastructure and a comprehensive, needs-driven service offering, Swisscom makes an important contribution to Switzerland’s competitiveness and economic success and generates direct added value. Operating added value is equivalent to net revenue less goods and services purchased, other indirect costs and depreciation and amortisation. Personnel expense in the statement of added value is treated as use of added value rather than as an intermediate input.
| 2018 | 2017 | |||||||||||
|---|---|---|---|---|---|---|---|---|---|---|---|---|
In CHF million |
Switzer- land |
Abroad |
Total |
Switzer- land |
Abroad |
Total |
||||||
| Added value | ||||||||||||
| Net revenue | 9,274 | 2,440 | 11,714 | 9,476 | 2,186 | 11,662 | ||||||
| Capitalised self-constructed assets and other income | 347 | 114 | 461 | 325 | 183 | 508 | ||||||
| Direct costs | (2,001) | (953) | (2,954) | (1,946) | (775) | (2,721) | ||||||
| Other operating expenses 1 | (1,571) | (601) | (2,172) | (1,594) | (549) | (2,143) | ||||||
| Depreciation and amortisation 2 | (1,521) | (586) | (2,107) | (1,528) | (586) | (2,114) | ||||||
| Intermediate inputs | (4,746) | (2,026) | (6,772) | (4,743) | (1,727) | (6,470) | ||||||
| Operating added value | 4,528 | 414 | 4,942 | 4,733 | 459 | 5,192 | ||||||
| Other non-operating result 3 | (62) | (72) | ||||||||||
| Total added value | 4,880 | 5,120 | ||||||||||
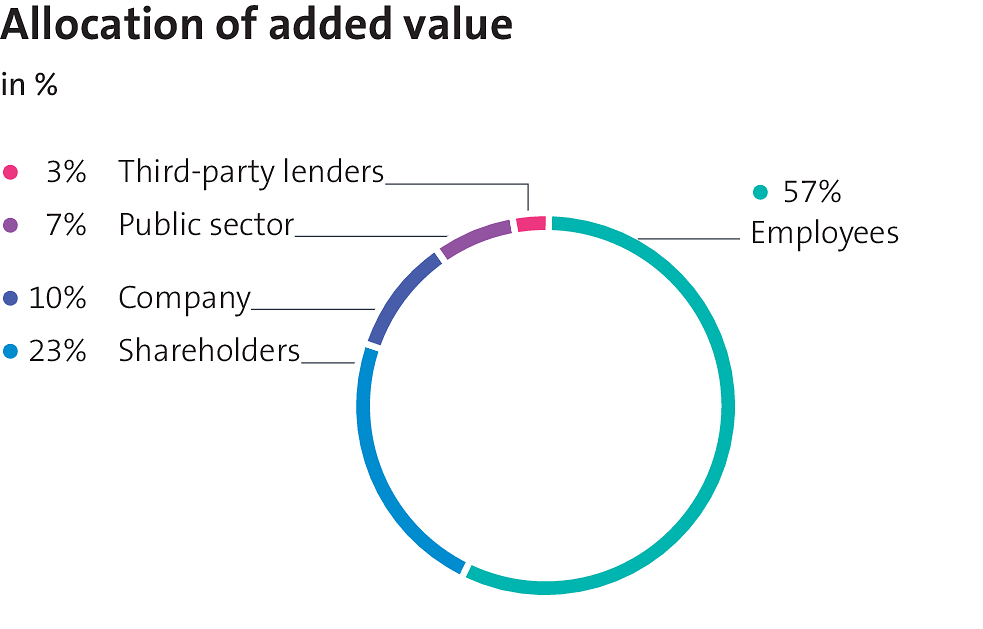
| Allocation of added value | ||||||||||||
| Employees 4 | 2,531 | 224 | 2,755 | 2,666 | 244 | 2,910 | ||||||
| Public sector 5 | 335 | 25 | 360 | 376 | 18 | 394 | ||||||
| Shareholders (dividends) | 1,141 | 1,148 | ||||||||||
| Third-party lenders (net interest expense) | 128 | 149 | ||||||||||
| Company (retained earnings) 6 | 496 | 519 | ||||||||||
| Total added value | 4,880 | 5,120 | ||||||||||
|
1 Other operating expense: excluding taxes on capital and other taxes not based on income.
|
||||||||||||
|
2 Depreciation and amortisation: excluding amortisation of acquisition-related intangible assets such as brands or customer relations.
|
||||||||||||
|
3 Other non-operating result: financial result excluding net interest expense, result of equity-accounted investees, and amortisation of acquisition-related intangible assets.
|
||||||||||||
|
4 Employees: employer contributions are reported as pension cost, rather than as expenses according to IFRS.
|
||||||||||||
|
5 Public sector: current income taxes, taxes on capital and other taxes not based on income.
|
||||||||||||
|
6 Company: including changes in deferred income taxes and defined benefit obligations.
|
||||||||||||
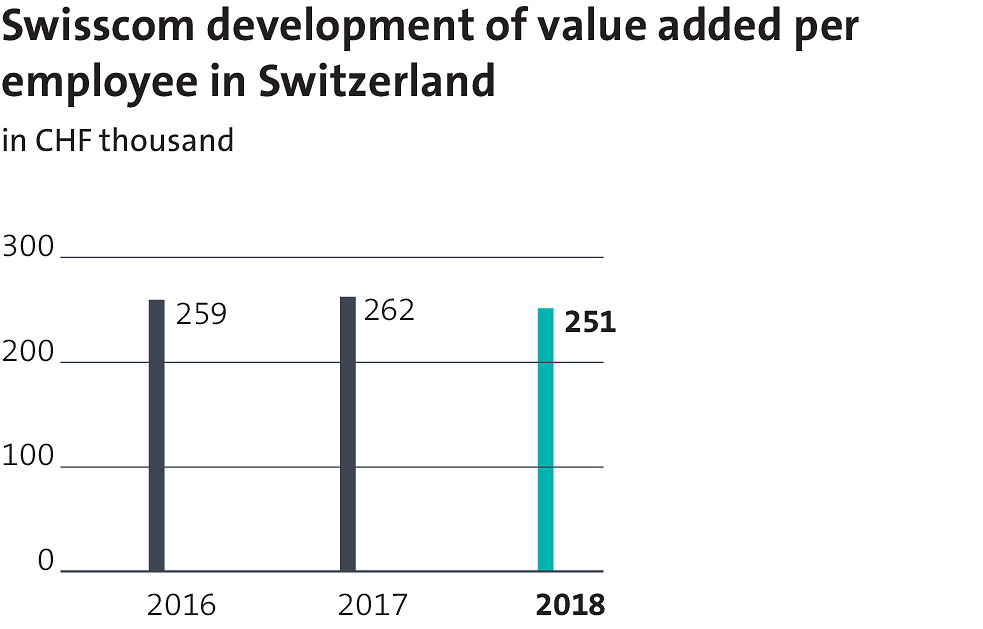
Of the consolidated operating added value of CHF 4.9 billion, 92% or CHF 4.5 billion was generated in Switzerland, which was 4.3% less than in the previous year. At the same time, added value per FTE was 3.8% lower at CHF 251,000. In addition to direct added value, purchases from suppliers provide significant indirect added value for Switzerland’s economic development. Taking into account capital expenditure instead of depreciation and amortisation, the purchasing volume in the Swiss business was around CHF 4.9 billion in 2018, with added value contributed by suppliers in Switzerland of approximately 60% or CHF 2.9 billion.